Clear lineage. Faster documentation. Better decisions.
Fabric Lineage Workbench
Track dependencies across semantic models, datasets, reports, and visuals so business stakeholders can audit data flows confidently and BI experts can document changes in a fraction of the time.
Preview
Product in action
Lineage graph in action
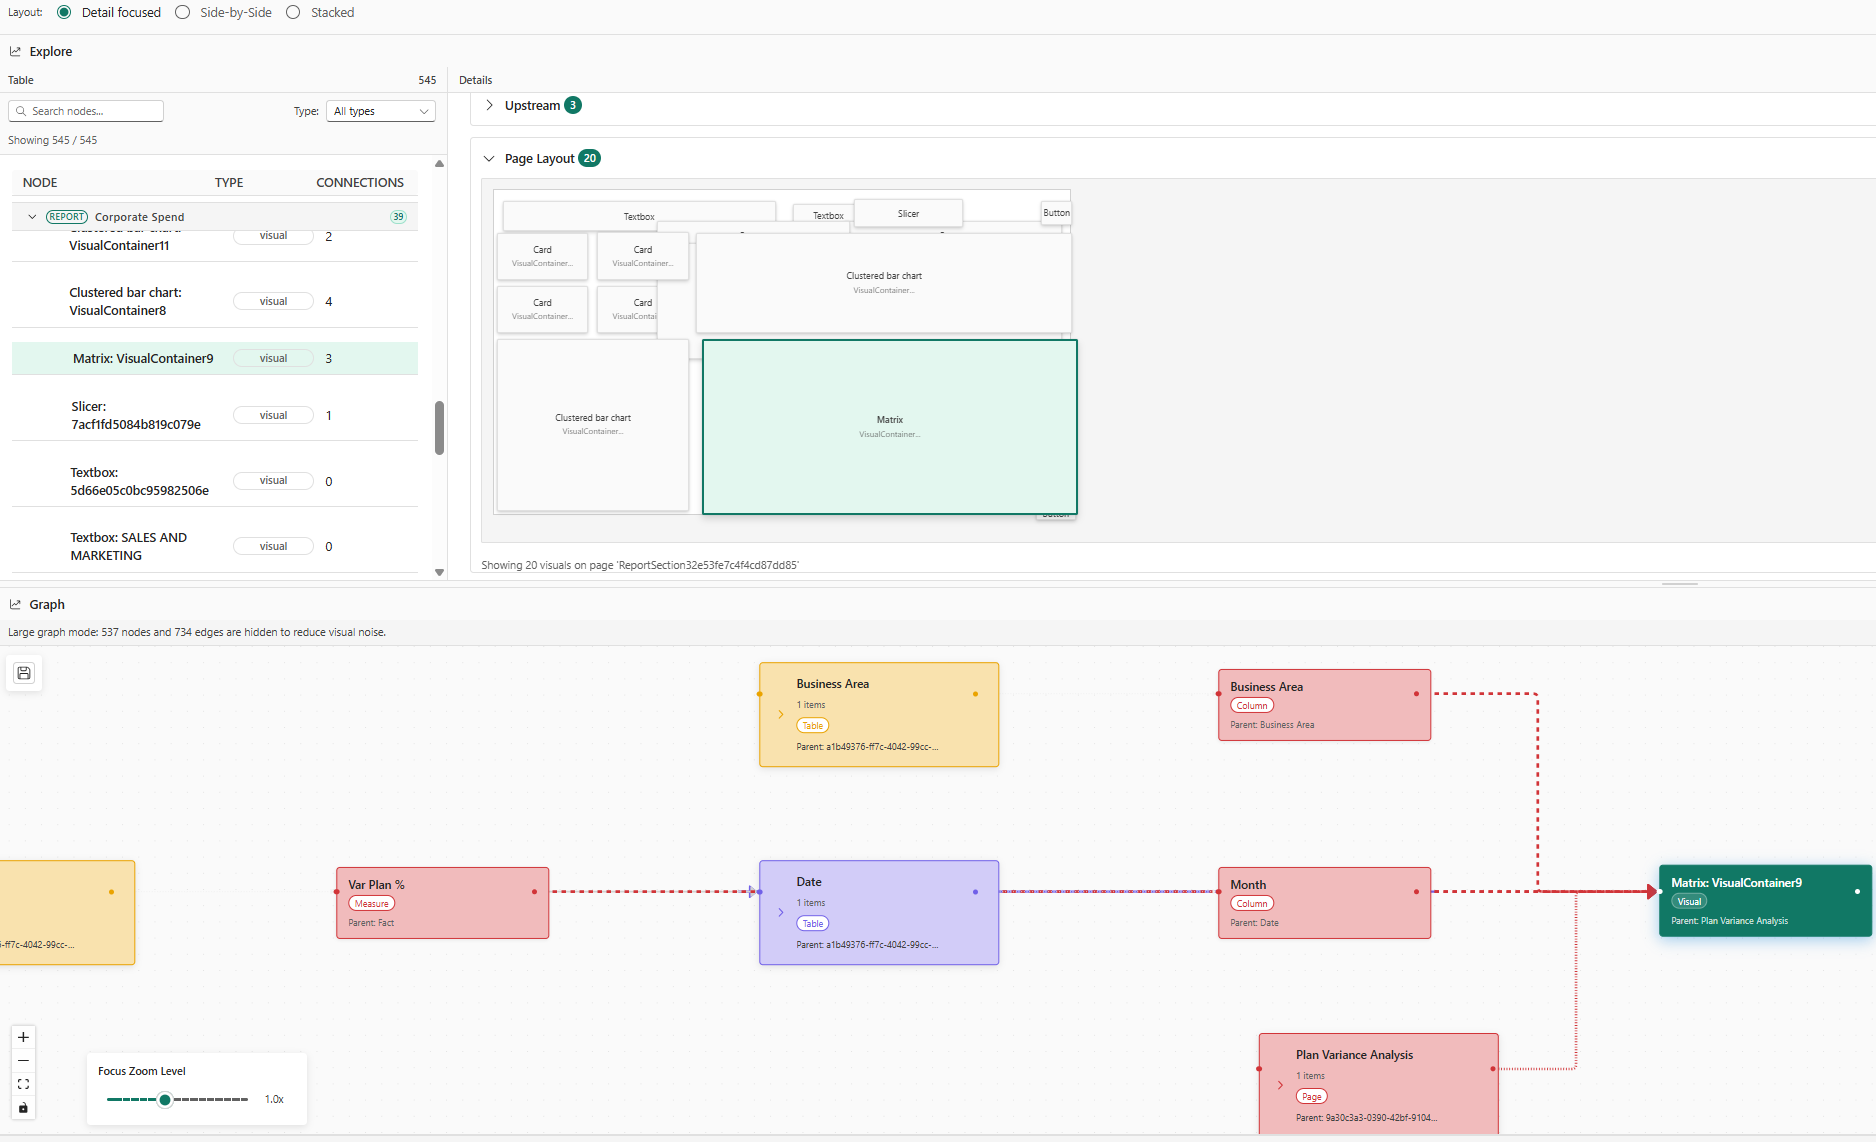
Detail panel and dependencies
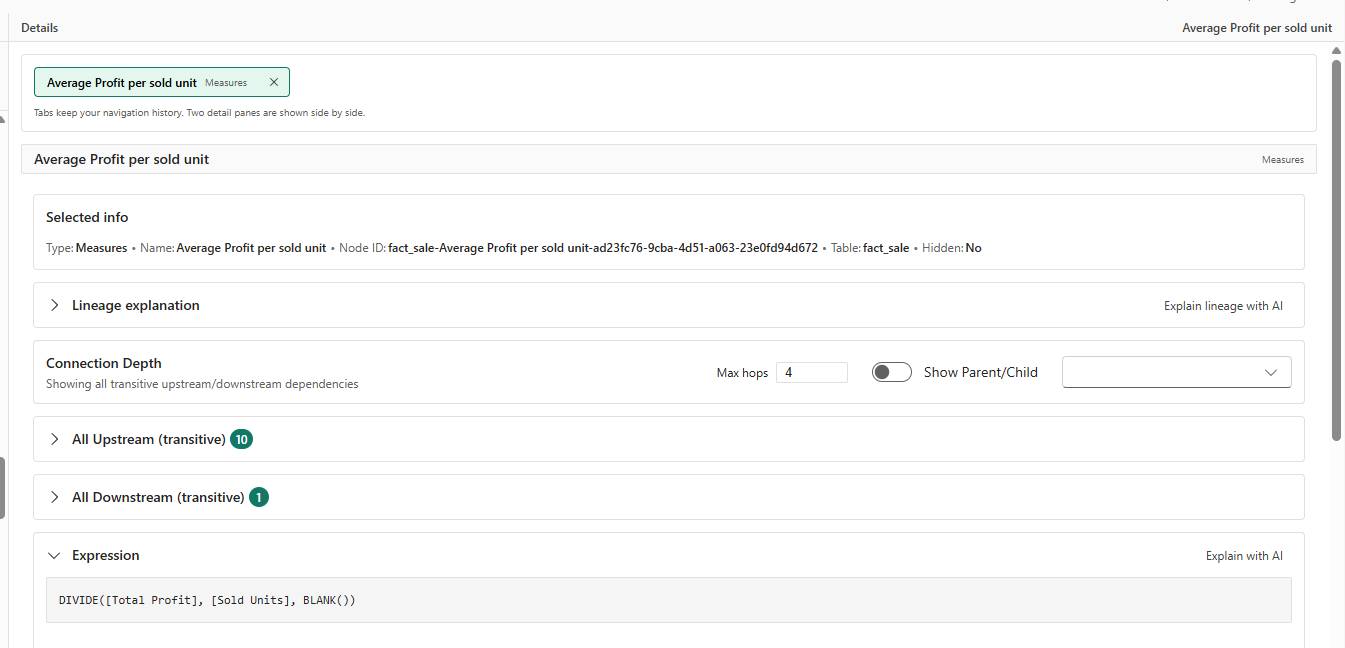
Impact analysis flow
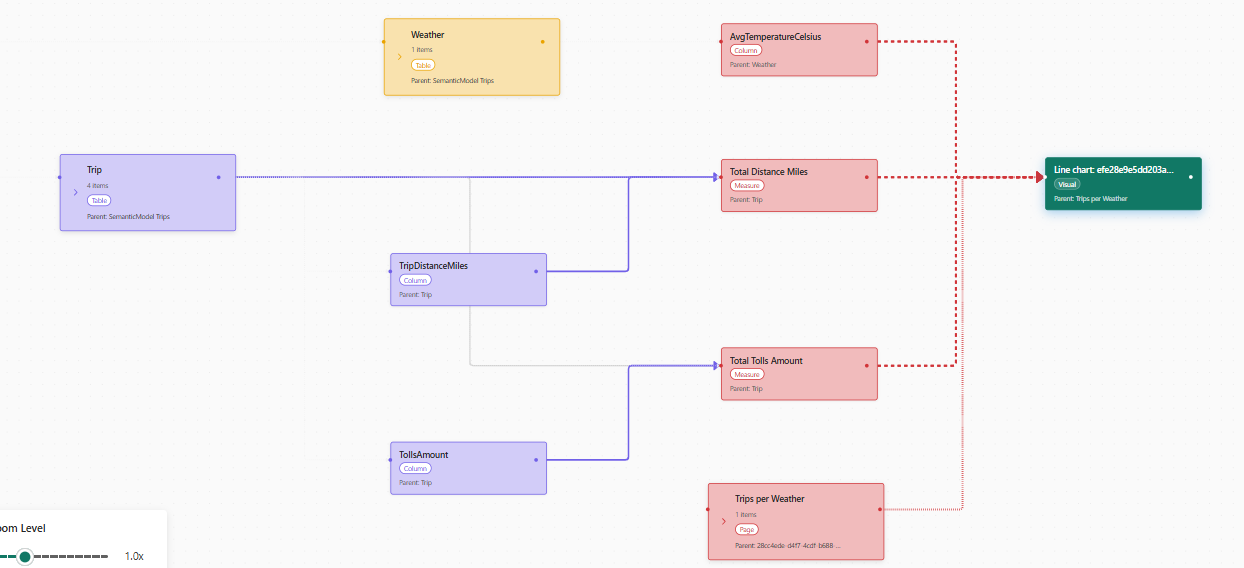
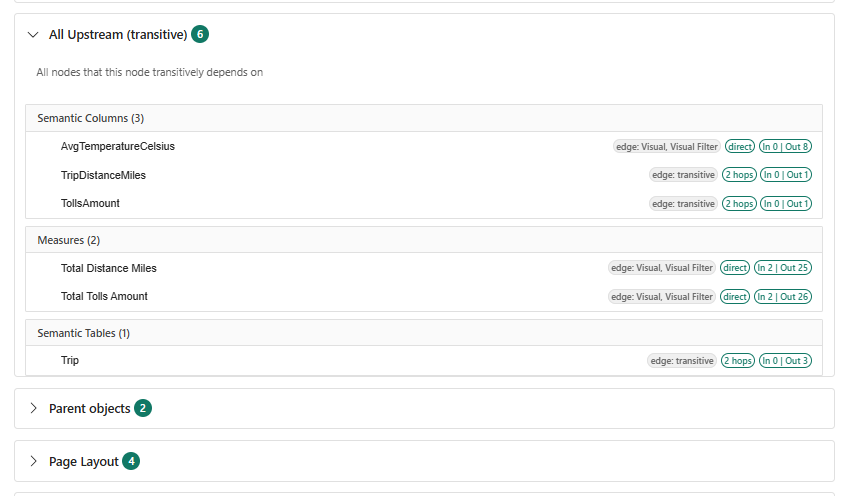
Direct and indirect dependencies
FAQ
Common questions
Why did you create Lineage Workbench?
I am a Microsoft Fabric consultant and have worked for several customers' BI projects. I have seen many cases where a small change in a semantic model or dataset caused unexpected issues in reports and dashboards. I created Lineage Workbench to help teams visualize dependencies, assess change risk, and document lineage more efficiently.
How does extraction work?
Lineage Workbench uses extraction notebooks to collect metadata from selected workspaces and artifacts. The extracted data is stored in a lakehouse for analysis and visualization. The Notebooks can be triggered from inside the workbench or scheduled to run automatically. The extraction process is designed to be efficient and can be customized based on the user's needs.
Can I use the extracted data outside the lineage workbench?
Since all data is stored in a lakehouse, you can use it for other purposes. You can create your own reports, dashboards, or analysis based on the extracted metadata. The lineage workbench provides a convenient interface to visualize and explore the data, but you are free to use it in any way that suits your needs.
What does it cost?
How does this help with audit and compliance reviews?
Teams can show traceable upstream and downstream lineage for business-critical metrics, making audit discussions faster and more evidence-based.
How does this help BI experts document faster?
The graph context and linked requirements reduce manual documentation effort by keeping dependency paths, impacted assets, and delivery notes in one workflow.
What features are expected in the future?
For future releases, I am awaiting customer feedback and will prioritize features based on demand. Some ideas include: more artifact types, performance improvements, a more sophisticated requirements board, and write back capabilites directly into datasets and lakehouses.
Contact
patrick@patrickmaul.de
For pilot projects, demos, or stakeholder workshops, send a message any time.